HYPER-V MEMORY FORENSICS PLUGINS WITH VOLATILITY

Friday, 17. October 2014

My motivation for this project has to do with the number of hyper-v systems that I interact with on a day-to-day basis. I recently came across a compromised Windows 2008R2 Hyper-V host and wrote this plugin to improve my understanding of the code base and to create something useful for future use. Hopefully there is some interest in the plugin so I can continue its development to enhance its features.
Anyone looking for the GrrCON 2014 presentation you can get it here https://drive.google.com/file/d/0Bz3L4ZnVlUY8RlNsR1FpY0o5V1U/view?usp=sharing

I have three very simple, but useful plugins currently, which are hpv_vmconnect, hpv_vmwp, and hpv_clipboard. You can download them  at: https://github.com/wroersma/volplugins/blob/master/hpv.py

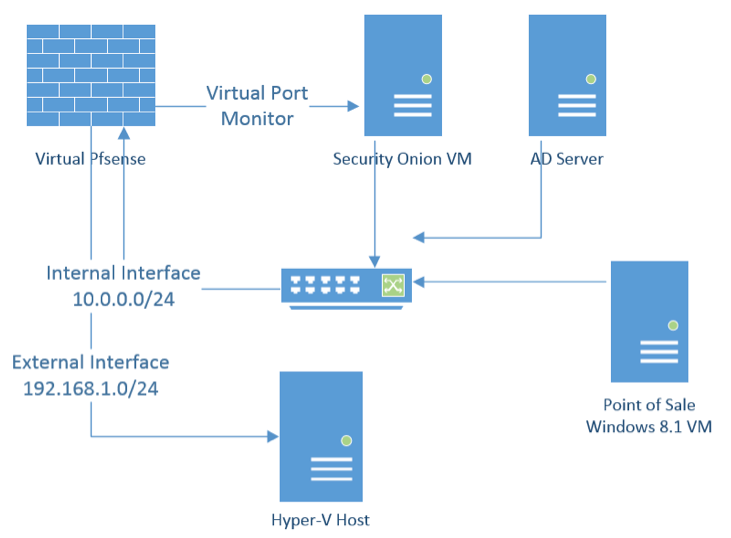
To help you visualize how the networking is configured on my hyper-v host, here is a simple Visio diagram of how it’s set up.
visio

hpv_vmconnect

The vmconnect plugin tells you what user is currently using the virtual connect console on a particular virtual machine.  It displays their username, the domain they are connected from, and the create time also reflects when the current console was last accessed.

~/python  vol.py -f  Win2012R2.vmem –profile=Win2012R2x64 hpv_vmconnect
Volatility Foundation Volatility Framework 2.4
Process: vmconnect.exe
PPID: 1552
PID: 2684
Create Time: 2014-09-28 05:12:54 UTC+0000
Host Computer Name: HV01
User Name: wyatt
User Domain Name: domain.local
VM GUID: 16AA09F1-2B2C-4B8E-A46E-E6FAD7988878 

hpv_vmwp

The virtual machine GUID is the biggest identifier of the virtual machine and its components.  A user account with the GUID is dedicated to this process and has no rights otherwise. Using the GUID you can identify which process is running for each virtual machine on the hyper-v host server. More information can be found manually and I’d like to expand the plugin at some point to support that as well. The create time does reflect when the last virtual machine was started.

My original goal for this plugin was to implement a memory mapping technique from this process to the virtual machine. Unfortunately I was unable to accomplish this in time due to my lack of understanding, but will hopefully have time to finish this up in the near future.

~/python  vol.py -f  Win2012R2.vmem –profile=Win2012R2x64  hpv_vmwp
Volatility Foundation Volatility Framework 2.4
Name             PID    PPID   Create Time                    GUID
—————- —— —— —————————— —————————————-
vmwp.exe         2684   1552   2014-09-28 05:10:37 UTC+0000   16AA09F1-2B2C-4B8E-A46E-E6FAD7988878  

hpv_clipboard

While I need to improve upon the formatting, this plugin displays data typed the hyper-v virtual console through the “Type Clipboard Text” option and will also display hotkey commands like Ctrl-Alt-Del and if it completed successfully or not.

All clipboard data is listed right after the process in which the data is discovered. I need to work on a better format to display the difference between what each process is responsible for.

~/python  vol.py -f  Win2012R2.vmem –profile=Win2012R2x64  hpv_clipboard
Volatility Foundation Volatility Framework 2.4
Process : vmconnect.exe   PID : 2684
Clipboard Data: Simulating typing Ctrl-Alt-Del.
Clipboard Data: Simulating typing Ctrl-Alt-Del completed successfully.
Clipboard Data: Simulating typing ASCII characters ‘{0}’.
Clipboard Data: Simulating typing ASCII characters completed successfully.
Clipboard Data: Simulating typing ASCII characters ‘d=bp=$6XZ\\ ,
Clipboard Data: Simulating typing ASCII characters ‘d=bp=$6XZ\\ ,y/_}K()Nk!’DVe,
Clipboard Data: Simulating typing ASCII characters ‘d=bp=$6XZ\\ ,
Clipboard Data: Simulating typing ASCII characters ‘d=bp=$6XZ\\ ,y/_}K()Nk!’DVe,

I plan to release another blog post following more data that I’m still in the process of researching. I will also be updating the plugins after some heavy testing, implementing some new features like listing the vm name, IP address, and other information. Follow my twitter account@wyattroersma to receive the latest updates for my blog! Also please feel free to leave feedback or contact me.

Hyper-V 2012 and 2012 R2 live virtual machine memory acquisition and analysis

Monday, 28. April 2014

Introduction

In my previous post I went over analyzing Hyper-V saved state files in Volatility  using a tool call vm2dmp. I mentioned some limits of the tool for VM’s on 2012 and later Hyper-V host systems. Another major downside was a limit of 4GB RAM size on the VM, which would cause the tool itself to crash out. However the biggest downside was having to actually pause a running VM to obtain the data with no live acquisition option for anyone who can’t just take a server down in the middle of the day.

Using a tool called LiveKd we now can analyze Windows virtual machines on both the 2012 and 2012 R2 platforms including VM’s with RAM sizes larger than 4GB. LiveKd also brings a major feature that vm2dmp wasn’t capable of, you can use it to dump out the memory of a live VM into Microsoft crash dump format without pausing it. This will be very critical for an incident response analyst that can’t pause VM’s for memory acquisition. LiveKdalso requires that the Debugging Tools for windows be installed on the Hyper-V host itself which can have some impact if you don’t already have them installed.

Acquisition

Requirements for the Hyper-V host

Install the Debugging Tools for Windows

Download LiveKd from Sysinternals and extract to the directory of C:\Program Files (x86)\Windows Kits\8.1\Debuggers\x64

Run an elevated command prompt and change the directory to the location of LiveKd.exe

Run livekd.exe (Accept the EULA)

If you haven’t installed symbols for the Hyper-V host, LiveKD will ask if you want it to automatically configure the system to use Microsoft’s symbol server, or you can manually set the symbols yourself.

FirstLiveKdrun2
If you want to list the virtual machines on the server just use the –hvl options and it will list GUIDs and names of running Hyper-V VM’s.

Example: livekd.exe –hvl

livekd -hvl

If you want to create a full crash dump of a virtual machine running on the host system you would run

>livekd.exe –hv (System name or GUID) –p (to pause the system to create a more consistent image) –o (output-file)

Example: livekd.exe –hv DFIR-PC –p –o DFIR-PC.dmp

livekd dump vm

If the virtual machine cannot be paused due to business reasons, you may omit the –p command line option, and create a crash dump from the live running VM. From my testing I can confirm that very little image smearing occurs. For further command line options visit Using LiveKD. Because Volatility  supports the crash dump address space you can then use all the normal plugins.

Once you have converted to a crash dump you then use Volatility’s  Imagecopy plugin to convert the crash dump format to a raw memory dump.

Example: python vol.py –f /dir/crash dump

–profile=/profile/of/vm/ -O /dir/memory.raw

Once the memory dump is in a raw format you can use the raw image in other tools like Redline.

Currently this process is limited to virtual machines running Windows only, in my next blog post I’ll discuss the acquisition process for linux VM’s in Hyper-V 2012 R2.

If anyone has any helpful feedback please DM me on twitter @wyattroersma even more so if you have found something stated here that isn’t accurate.

Other References:

http://blogs.technet.com/b/markrussinovich/archive/2010/10/14/3360991.aspx


Analyzing Hyper-V Saved State files in Volatility

Thursday, 17. October 2013

Introduction

Volatility can analyze Hyper-V Virtual Machine’s saved state once the (.bin) and (.vsv) files are converted to a crash dump using vm2dmp http://archive.msdn.microsoft.com/vm2dmp. This tool currently supports up to Hyper-V 2.0 (Windows Server 2008R2 and 2008) files. At this point I do not know of any support for Hyper-V 3.0 (Windows Server 2012 and up). In order for this process to work the VM must either be in a saved state or from a snapshot.

Acquisition

The Virtual Machine configuration (XML file located in the virtual machine folder in the path of the virtual machine) file points to the path of the .bin and .vsv files that are required to convert them to a crash dump.  For example the follow snippet was pulled from one of my virtual machines XML file. Recently I have discovered that any VM that has 4GB of RAM or more will cause the VM2DMP with an error like “ERROR: Failed to map guest block 4096 to any saved state block! ERROR: Element not found.”

<savedstate>

<memlocation type=”string”>

V:\ComputerName\Virtual Machines\VM-Instance-ID\VM-Instance-ID.bin

</memlocation>

<type type=”string”>Normal</type><vsvlocation type=”string”>

V:\ComputerName\Virtual Machines\VM-Instance-ID\VM-Instance-ID.vsv

</vsvlocation>

</savedstate>

Once you obtain the .bin and .vsv files you need to download vm2dmp and place in the dir of the windows debugging toolkit

Download Windows Debugging Toolkit

http://msdn.microsoft.com/en-us/library/windows/hardware/ff551063(v=vs.85).aspx

Now you can use the vm2dmp tool to convert the files into a crash dump.

Create a dump file using virtual machine state files:

vm2dmp.exe -bin C:\dir\ VM-Instance-ID.bin -vsv C:\VM\ VM-Instance-ID.vsv -dmp C:\dir\crashdump.dmp

Create a dump file from virtual machine and snapshot name:

vm2dmp.exe –vm ComputerName -dmp C:\VM\crashdump.dmp

vm2dmp.exe –vm ComputerName –snap “vm ComputerName -snap-SP1” -dmp C:\VM\crashdump.dmp

Note: If you have a downloaded path of the debugging symbols then you can specify –sym and then the directory of the symbols path.

Once you have converted to a crashdump you then use Volatility’s Imagecopy plugin to convert the crashdump format to a raw memory dump. For more information check out

https://code.google.com/p/volatility/wiki/CommandReference22#imagecopy

Example: python vol.py –f /dir/crashdump – -profile=profile of vm –O /dir/memory.raw